背景
进行置换多元方差分析(PERMANOVA,Adonis),画出图b
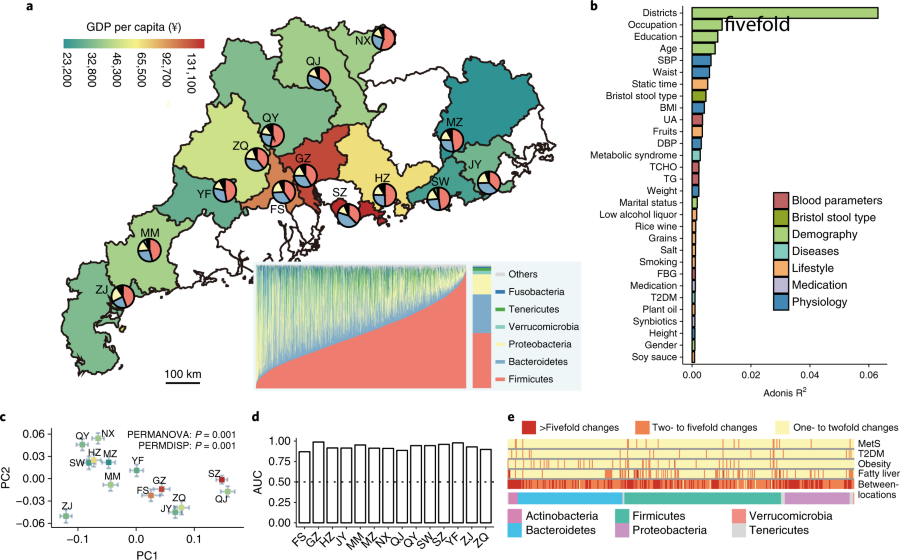
Fig. 1: Overview of sampling regions and of regional variation in gut microbiota.
b, Bar plot illustrating the top 30 host factors found to be significantly associated with gut microbial variations. The variations were derived from between-sample weighted UniFrac distances. The bars are colored according to metadata categories. Size effect and statistical significance were calculated by PERMANOVA (Adonis). FDR was controlled at 5%. DBP, diastolic blood pressure; TCHO, total cholesterol; FBG, fasting blood glucose.
出自文章PMID: 30150716
应用场景
分析不同分组或环境因子对样品差异的解释度,例如例文中宿主的临床表型对肠道微生物的影响。
输入数据
三个输入文件:
#肠道微生物数据,每行为一种肠道微生物,每一列为一个样本
mydata <- read.table("easy_input_meta.txt",head=T,sep = "\t",row.names = 1)
mydata <- t(mydata) #转置
mydata[1:3,1:4]

#理化因子表格,每行为一个样本,每一列为一个因子,例如年龄、疾病、吸烟等
myfactor <- read.table("easy_input_factors.txt",header = T,sep = "\t", row.names = 1)
head(myfactor)

#非必需,理化因子的分组信息,例如某几个因子都属于生活方式
gp <- read.table("easy_input_factor.group.txt",head=F,sep = "\t")
colnames(gp) <- c("factor","group")
head(gp)
开始计算
#进行adonis分析
library(vegan)
result <- adonis(mydata ~ ., data = myfactor)
mytable <- as.data.frame(result$aov.tab)
mytable <- mytable[1:ncol(myfactor),]

#是否进行p值校正并根据校正后p值挑选
fdr <- T

if(fdr == T){
  #p.adjust
  mytable$fdr <- p.adjust(mytable$`Pr(>F)`,method = "fdr")
  #根据fdr挑选理化因子
  choose <- mytable[mytable$fdr < 0.05,]
}else{
  choose <- mytable[mytable$`Pr(>F)` < 0.05,]
}

#把计算结果保存到文件,可以像例文那样,作为文章的补充材料
write.csv(choose,"output_Adonis.csv",quote = F)
开始画图
library(ggplot2)
#根据R2排序
choose <- choose[order(choose$R2),]
choose$factor <- factor(row.names(choose),levels=row.names(choose))

#定义足够多的颜色,对应理化因子分组的数量
mycol <- c("#BD6263","#8EA325","#A9D179","#84CAC0","#F5AE6B","#BCB8D3","#4387B5")

#理化因子有无分组
group <- T #此处有分组信息

if(group == T){
  choose <- merge(choose,gp,by="factor")
  ggplot(choose,aes(x=factor, y=R2, fill = group)) + #按分组填充颜色
    geom_bar(stat = "identity",color = "black") + #bar有黑色边框
    scale_x_discrete(expand = c(0,0)) + #上下不留空
    scale_fill_manual(values = mycol) + #使用自定义的配色

    labs(x="",y="Adnois R2") +
    coord_flip() + #坐标轴互换

    theme_bw() + #去除背景色
    theme(panel.grid =element_blank()) + #去除网格线
    theme(panel.border = element_blank()) + #去除外层边框
    theme(axis.line = element_line(colour = "black")) +#沿坐标轴显示直线

    guides(fill = guide_legend(title = NULL))

}else{
  #不提供分组信息的情况
  ggplot(choose,aes(x=factor,y=R2),fill = "black") +
    geom_bar(stat = "identity",color = "black") +
    scale_x_discrete(expand = c(0,0)) +

    labs(x="", y="Adnois R2") +
    coord_flip() +
    theme_bw() +
    theme(panel.grid =element_blank()) +
    theme(panel.border = element_blank()) +
    theme(axis.line = element_line(colour = "black")) +

    guides(fill = guide_legend(title = NULL))
}

#保存到PDF文件
ggsave("adonis_barplot.pdf")

 |Archiver|手机版|小黑屋|bioinfoer
( 萌ICP备20244422号 )
|Archiver|手机版|小黑屋|bioinfoer
( 萌ICP备20244422号 )

 发表于 2025-6-3 21:14:59