画出优雅的气泡图
# 背景
模仿出2016年XieWei老师Nature的泡泡图Figure 4a。

PMID:27309802

# 一、使用场景
同时展示pvalue和表达量,例如:
- 场景一、展示motif的pvalue和motif对应的转录因子的表达量,就能看出哪个转录因子在哪个group里富集且表达量高,预示着它对细胞状态的改变(例如细胞分化、转移、应激)起关键调控作用。
- 场景二、做基因功能富集分析时,展示富集的通路qvalue和基因数量或geneRatio。
# 二、输入数据
第一种:
把自己的数据整理成easy_input.txt的格式,就可以跳过“输入数据的格式化”,直接进入“开始画图”。第一列是基因名,后面几列依次是各个sample里motif的pvalue,然后是motif的名字,后面是FPKM值。
第二种:
motif的pvalue,用homer找motif,产生knownResults.txt,其中包含了在peak(目标基因组区域)中富集的已知motif。一共10个sample,分别保存在10个文件夹里。
RNA-seq表达值,在终端里运行下面两行代码,下载并解压缩FPKM:
```shell
wget ftp://ftp.ncbi.nlm.nih.gov/geo/series/GSE66nnn/GSE66582/suppl/GSE66582_stage_FPKM.txt.gz
gunzip GSE66582_stage_FPKM.txt.gz
```
# 三、输入数据预处理
```R
rm(list = ls())####魔幻操作,一键清空~
getwd()
setwd('D:/rtmp/heatbabble/')
##读入knownResults.txt中的记录
library(data.table)
cell2<-read.delim(file="2cell_peaks_motifDir/knownResults.txt",header=T,as.is=T)
cell8<-read.delim(file="8cell_peaks_motifDir/knownResults.txt",header=T,as.is=T)
cell4<-read.delim(file="4cell_peaks_motifDir/knownResults.txt",header=T,as.is=T)
icm<-read.delim(file="icm_peaks_motifDir/knownResults.txt",header=T,as.is=T)
es200<-read.delim(file="200_es_peaks_motifDir/knownResults.txt",header=T,as.is=T)
es1k<-read.delim(file="1k_es_peaks_motifDir/knownResults.txt",header=T,as.is=T)
es50k<-read.delim(file="50k_es_peaks_motifDir/knownResults.txt",header=T,as.is=T)
##merge these dataframes with motif names and change gene name to upper
##对于变量名,R默认是区分大小写的。knowResults.txt中motif中的基因名和FPKM中的基因名大小写规则是不同的。统一成大写后方便用R从FPKM文件中提出motif对应TF的表达量
rownames(cell2)<-paste(cell2[,1],cell2[,2],sep="-")
rownames(cell4)<-paste(cell4[,1],cell4[,2],sep="-")
rownames(cell8)<-paste(cell8[,1],cell8[,2],sep="-")
rownames(icm)<-paste(icm[,1],icm[,2],sep="-")
rownames(es200)<-paste(es200[,1],es200[,2],sep="-")
rownames(es1k)<-paste(es1k[,1],es1k[,2],sep="-")
rownames(es50k)<-paste(es50k[,1],es50k[,2],sep="-")
##每个peak文件用homer跑出的结果文件knowResults.txt中都包含所有巳知motif的富集分析情况,它的行是按P-value从小到大排列的,因此,不同的knowResults.txt都会有364行记录。但motif 顺序是不同的,这条命令是把所有knowResults.txt的Log(P-value)取负后合并到一个数据框里,合并时行顺序是cell2的行名顺序,当然你也可以用任何一个knowResults.txt中motif的顺序。
myidx<-rownames(cell2)
logpvals<-data.frame(cell2=-cell2$Log.P.value,
cell4=-cell4$Log.P.value,
cell8=-cell8$Log.P.value,
icm=-icm$Log.P.value,
es200=-es200$Log.P.value,
es1k=-es1k$Log.P.value,
es50k=-es50k$Log.P.value,
row.names=myidx,
gene=apply(cell2,1,function(x)(toupper(strsplit(strsplit(x,"/")[],"-")[]))))
##按照paper中的标准筛选know motif
##filter rows with P-value< 1e-10
filtvals<-logpvals))))>-log(1e-10),]
filtvals$id<-rownames(filtvals)
##读入RNA表达谱中的记录
##read FPKM file and change gene name to upper
fpkm<-read.table(file="GSE66582_stage_FPKM.txt",header=T)
fpkm$gene<-toupper(fpkm$gene) #换成大写,与之前处理一致
##merge pvalue file and fpkm file by gene and filter rows with a FPKM below 5
mergefpkm<-merge(filtvals,fpkm,by="gene")
mergefpkm<-mergefpkm))>5)),]
mergefpkm<-mergefpkm
write.table(mergefpkm,"20230905.txt",row.names = F,quote = F,sep = "\t")
```
# 四、画图
你可以把自己的数据整理成20230905.txt这样的格式,就可以跳过上面调整格式的步骤。 第一列是基因名,后面几列依次是各个sample里motif的pvalue,然后是motif的名字,后面是FPKM值。
```R
mergefpkm<-read.table("20230905.txt",header = T,as.is = 1)
head(mergefpkm)
##melt dataframe and draw figues
# install.packages('reshape2',destdir = 'C:/Users/haish/R/RStudiowork/downloaded_packages')
library(reshape2)
library(ggplot2)
m1<-melt(mergefpkm[,1:9],id.var=c("id","gene"),variable.name = "type",value.name = "-logP")
m2<-melt(mergefpkm[,c(1,9,13:17)],id.var=c("id","gene"),variable.name = "type",value.name = "FPKM")
m3<-rbind(m2,m2,m2)
# table(m2$type=="mESC")
m4<-cbind(m1,m3)
m5<-m4[,c(1:4,8)]
#set logP range and FPKM range
quantile(m5$`-logP`,probs = c(0:10)/10)
m5$`-logP` <- 500
quantile(m5$`-logP`,probs = c(0:10)/10)
m5$`-logP` <- 10
quantile(m5$`-logP`,probs = c(0:10)/10)
quantile(m5$FPKM,probs = c(0:10)/10)
m5$FPKM<-20
quantile(m5$FPKM,probs = c(0:10)/10)
#filtered_motifs.pdf,按照paper的描述筛选出来的motif
p1<-ggplot(m5,aes(type,id,size=`-logP`))+
geom_point(shape=21,aes(fill=FPKM),position =position_dodge(0))+
theme_minimal()+xlab(NULL)+ylab(NULL)+
scale_size_continuous(range=c(1,8))+
scale_fill_gradientn(colours=c("#2381B3","#F0E366"),guide="legend")+
theme(legend.position = "bottom",legend.box = "vertical",panel.grid.major =element_blank() )+
scale_y_discrete(labels=m5$id)
ggsave(file="filtered_motifs.pdf",height=18,width = 9)
#filtered_genes.pdf,上述motif对应的转录因子
p2<-ggplot(m5,aes(type,id,size=`-logP`))+
geom_point(shape=21,aes(fill=FPKM),position =position_dodge(0))+
theme_minimal()+xlab(NULL)+ylab(NULL)+
scale_size_continuous(range=c(1,8))+
scale_fill_gradientn(colours=c("#2381B3","#F0E366"),guide="legend")+
theme(legend.position = "bottom",legend.box = "vertical",panel.grid.major =element_blank(),legend.margin=margin(t= 0, unit='cm'),legend.spacing = unit(0,"in"))+
scale_size_continuous(range=c(0,10))+
scale_y_discrete(labels=m5$gene)
ggsave(file="filtered_genes.pdf",height=20,width = 4)
```
查看filtered_motifs.pdf,是按照paper的描述筛选出来的motif;
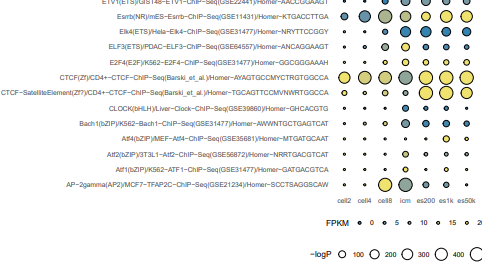
查看filtered_genes.pdf,是上述motif对应的转录因子。
可以看出,比paper的图多出了很多转录因子。而且同一转录因子对应多个motif,paper里的只出现一个motif,作者是怎么处理的呢?
paper作者Jingyi答复:
I think the reason why you have more motif is the different version of motif database we are using. The one I used in 2016 paper was an old one with relatively less motif included.
If one gene has multiple enrichment value, I choose the highest enrichment value to assign to that gene.
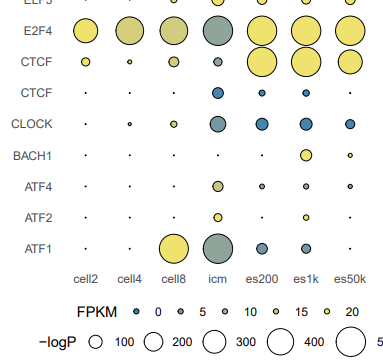
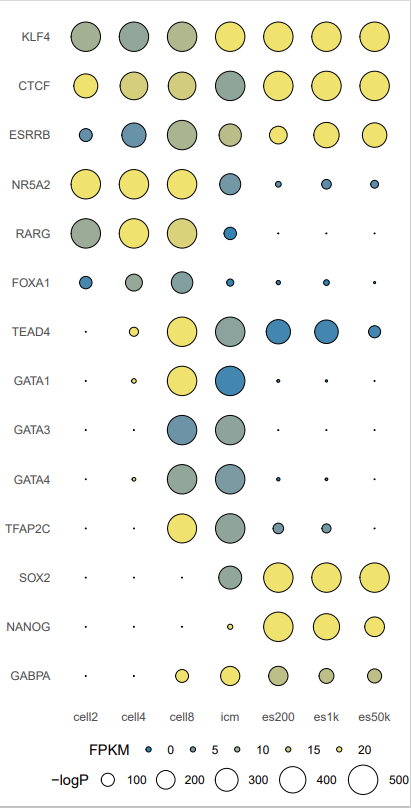
为了模仿出原版的效果,我们把paper里出现的转录因子对应的数据提取出来,重新画图。
```R
##filtering with motifs in the nature paper:The landscape of accessible chromatin in mammalian preimplantation embryos
papermotif<-c("GABPA","NANOG","SOX2","POU5F1","TFAP2C","GATA4","GATA3","GATA1","TEAD4","FOXA1","RARG","NR5A2","ESRRB","CTCF","KLF4")
pmergefpkm<-merge(mergefpkm,data.frame(gene=papermotif),by="gene")
pmergefpkm<-merge(mergefpkm,data.frame(gene=papermotif,sortid=letters),by="gene")
pmergefpkm<-pmergefpkm
pmergefpkm$id<-apply(pmergefpkm,1,function(x)(paste(x,x,sep="-")))
# length(pmergefpkm$id) #21
# length(papermotif) #15
#按照文章作者回应:同一个基因取motif表达值最大的
mean(pmergefpkm)
pmergefpkm$meanmotif <- apply(pmergefpkm, 1, mean)
pmergefpkm <- pmergefpkm
pmergefpkm <- pmergefpkm[!duplicated(pmergefpkm$gene),]
pmergefpkm<-pmergefpkm
pm1<-melt(pmergefpkm[,1:9],id.var=c("id","gene"),variable.name = "type",value.name = "-logP")
pm2<-melt(pmergefpkm[,c(1,9,13:17)],id.var=c("id","gene"),variable.name = "type",value.name = "FPKM")
pm3<-rbind(pm2,pm2,pm2)
pm4<-cbind(pm1,pm3)
pm5<-pm4[,c(1:4,8)]
pm5$`-logP`<-500
pm5$`-logP`<-10
pm5$FPKM<-20
#paper_motifs.pdf,paper的图里出现的转录因子对应的motif
p3<-ggplot(pm5,aes(type,id,size=`-logP`))+
geom_point(shape=21,aes(fill=FPKM),position =position_dodge(0))+
theme_minimal()+xlab(NULL)+ylab(NULL)+
scale_size_continuous(range=c(1,15))+
scale_fill_gradientn(colours=c("#2381B3","#F0E366"),guide="legend")+
theme(legend.position = "bottom",legend.box = "vertical",panel.grid.major =element_blank(),legend.margin=margin(t= 0, unit='cm'),legend.spacing = unit(0,"in"))+
scale_size_continuous(range=c(0,10))
ggsave(file="paper_motifs.pdf",height=8.4,width = 9)
#paper_gene.pdf,paper的图里出现的转录因子
ggplot(pm5,aes(type,id,size=`-logP`))+
geom_point(shape=21,aes(fill=FPKM),position =position_dodge(0))+
theme_minimal()+
xlab(NULL)+ylab(NULL)+
scale_size_continuous(range=c(1,15))+
scale_fill_gradientn(colours=c("#2381B3","#F0E366"),guide="legend")+
theme(legend.position = "bottom",legend.box = "vertical",panel.grid.major =element_blank(),
legend.margin=margin(t= 0, unit='cm'),legend.spacing = unit(0,"in"))+
scale_size_continuous(range=c(0,10))+scale_y_discrete(labels=pm5$gene)
ggsave(file="paper_gene.pdf",height=8.4,width = 4.3)
```
页:
[1]